
Here you can view the analytics for all virtual agenda items, or you can choose a specific agenda item to view
Overview
-
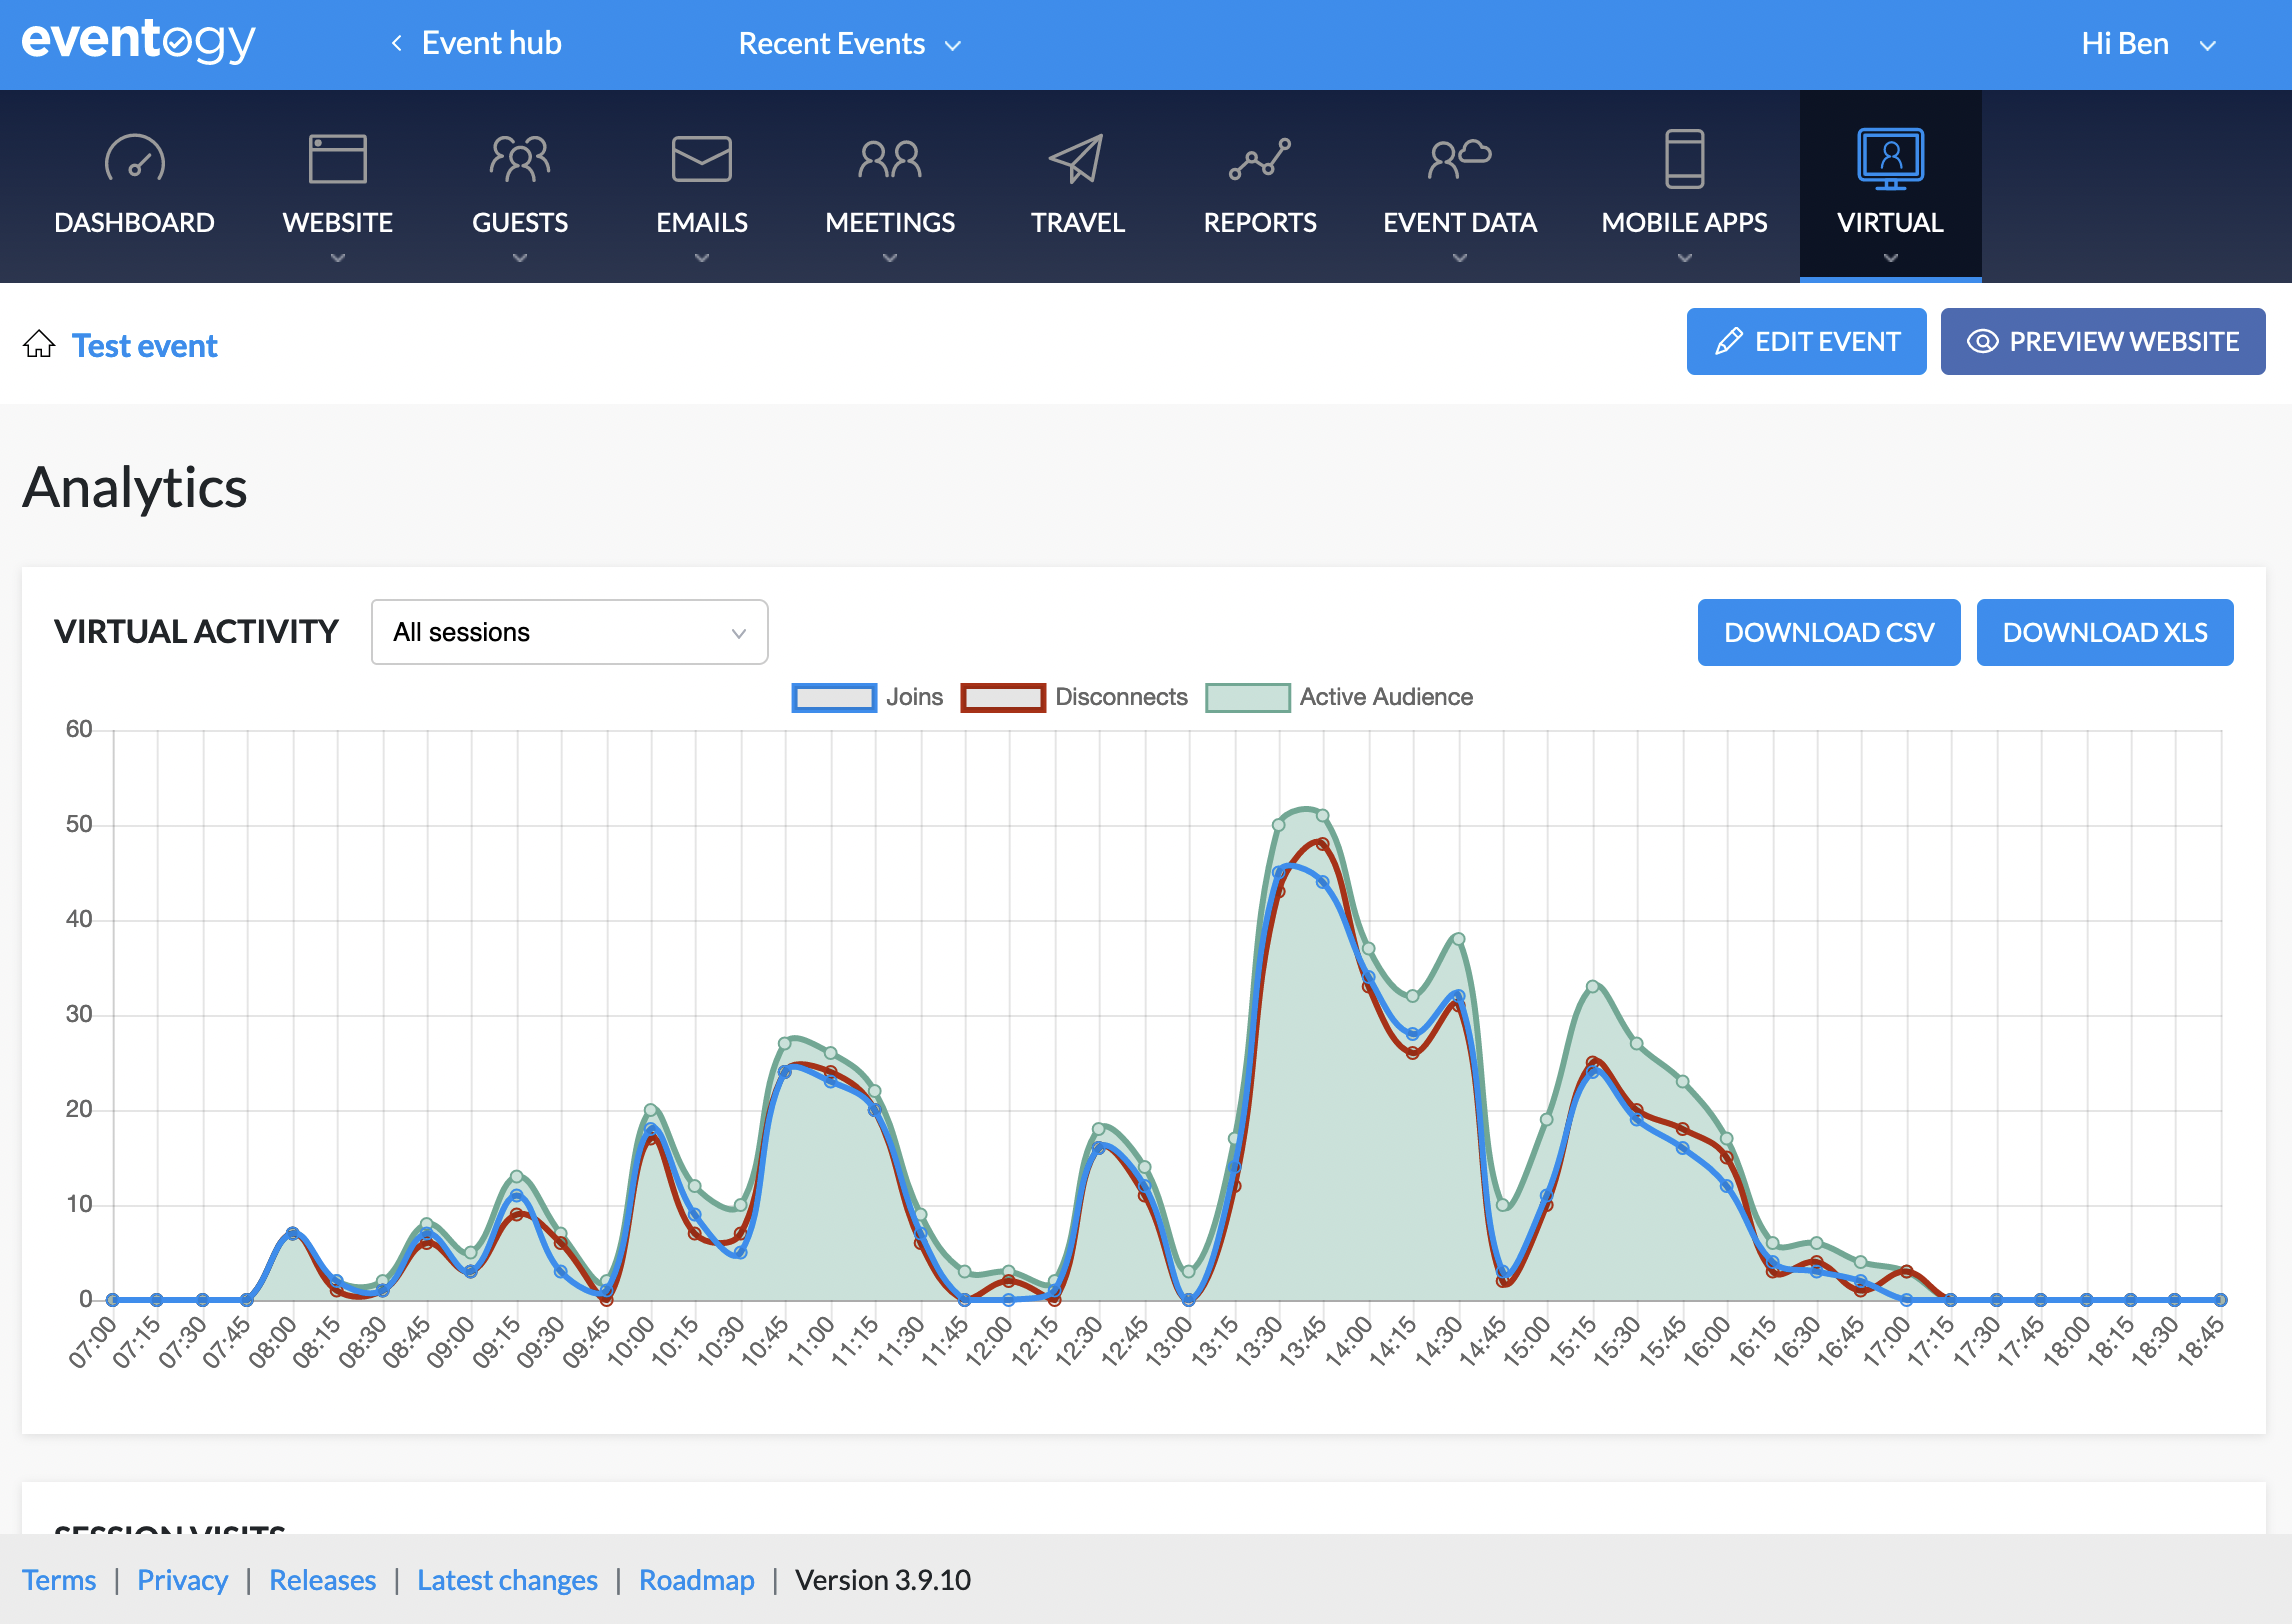
The Virtual Activity chart shows the total number of users connecting at various times, as well as the ‘active audience’ - the total number of users connected at that particular time.
-
Sessions Visits breaks down each session with the number of total visits, unique visits as well as the average time the users have spent on each session.
-
A report of the attendance can also be downloaded, in both XLS and CSV format.
Session visits
-
Here you can see the name of the session as well as:
-
Visits
-
Unique visits (the visits will say how many times people visited the item, unique visits looks are how many people visited it)
-
Average time
-
Your Audience
-
This outlines the following for guests on a virtual agenda item
-
Platform
-
Operating system
-
Browser
-
Comments
0 comments
Article is closed for comments.